Login Screen
Pressing Buttons
Pressing a button on the HoloLens2 may feel a bit off the first time you’re using it. The best way is to pretend it’s a real button and try to press it all the way through. When your finger gets close to the button, you should see some visual feedback. When the button got pressed successfully you’ll be notified by a kind of clicking sound.
Menus
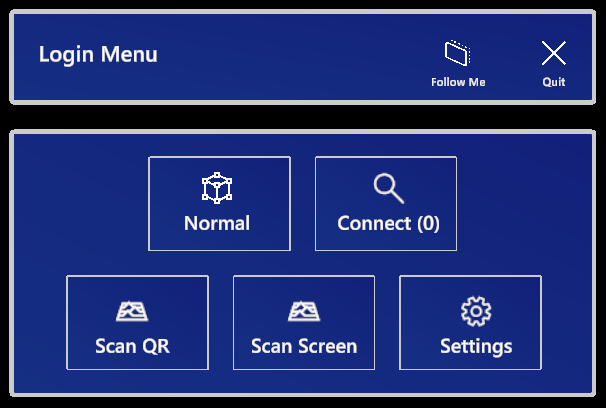
Entering chARpack you’re put into a menu environment, where you can choose the mode of operation.

The Login Menu is designed as a so called Near Menu, which means by default it will follow you around. To stop that behavior press the Follow Me button. This lets the menu stay in the same position in the room. By grabbing the Login Menu on top or the boarders, you can place it somewhere else in the room. Pressing the Follow Me button again lets the menu follow you around again. The button Quit obviously closes chARpack.
Normal
Pressing the button Normal puts you into the main building environment. For more details on this mode see the section Normal Mode of the manual.
Connect
The button Connect lets you connect to a chARpack server that is hosted in your network. The number in brackets behind the text gives an indication of how many servers are visible at the moment in the network.
Scan QR
The button Scan QR lets you scan room anchors for collaboration in the same room.
Scan Screen
The button Scan Screen lets you scan your desktop screen to enable Async Mode interactions.
Settings
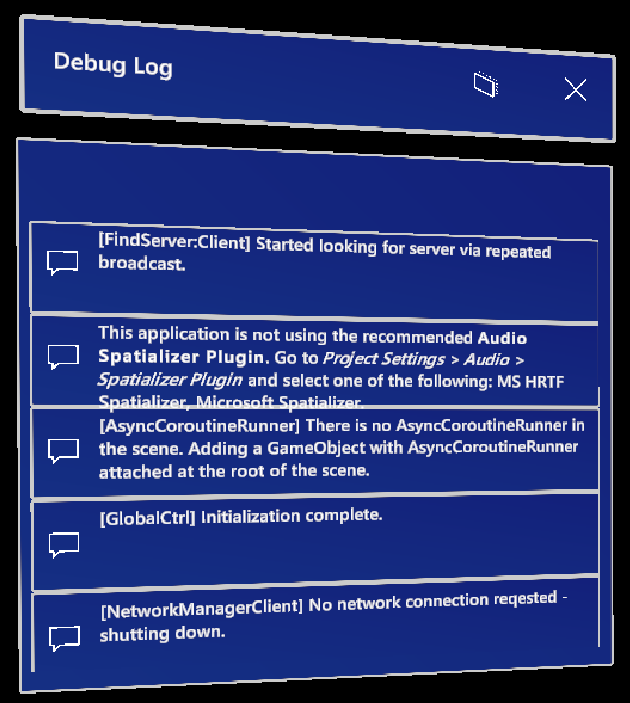
The button Settings opens a menu containing different settings; most of them are only useful once in Normal Mode or connected to a server. However, you can already do things such as changing the color scheme (the background color of the AR windows), switching the active language or opening a debug log for troubleshooting:
Similar to the functions of the Login Menu the debug log has a follow me function and can be placed by grabbing the top bar.

The button at the top left toggles a frame rate counter; when active, it is positioned in a comfortable location for AR purposes. This can be useful if you are experiencing performance issues.
Each entry of the debug log is clickable to get access to the stack trace. Using a scroll gesture like on a smart phone or pressing the arrow buttons on the right lets you scroll through the contents of the debug log. Behind some messages you will see a number in brackets. This number indicates how often this message was written to the log. If there is a severe problem, the number behind an error message will rise quickly. Normal debug output is displayed in white text, warnings in orange and error messages are displayed in red color. Checking the debug log and stack trace of the messages makes analyzing errors on the device significantly easier.
If you encounter any unexpected errors, please let us know via the Issue Tracker in our GitHub repository.
Just use the Go to GitHub button in the navigation bar on top.